What the tax threshold freeze has cost you
Income tax thresholds have not moved since April 2021. Work out what that is worth on your salary, using ONS inflation figures and the rates gov.uk published for each year.
More options
Thresholds are normally uprated by the previous September's CPI. This compares what you actually paid against what you would have paid had that continued.
The gap, year by year
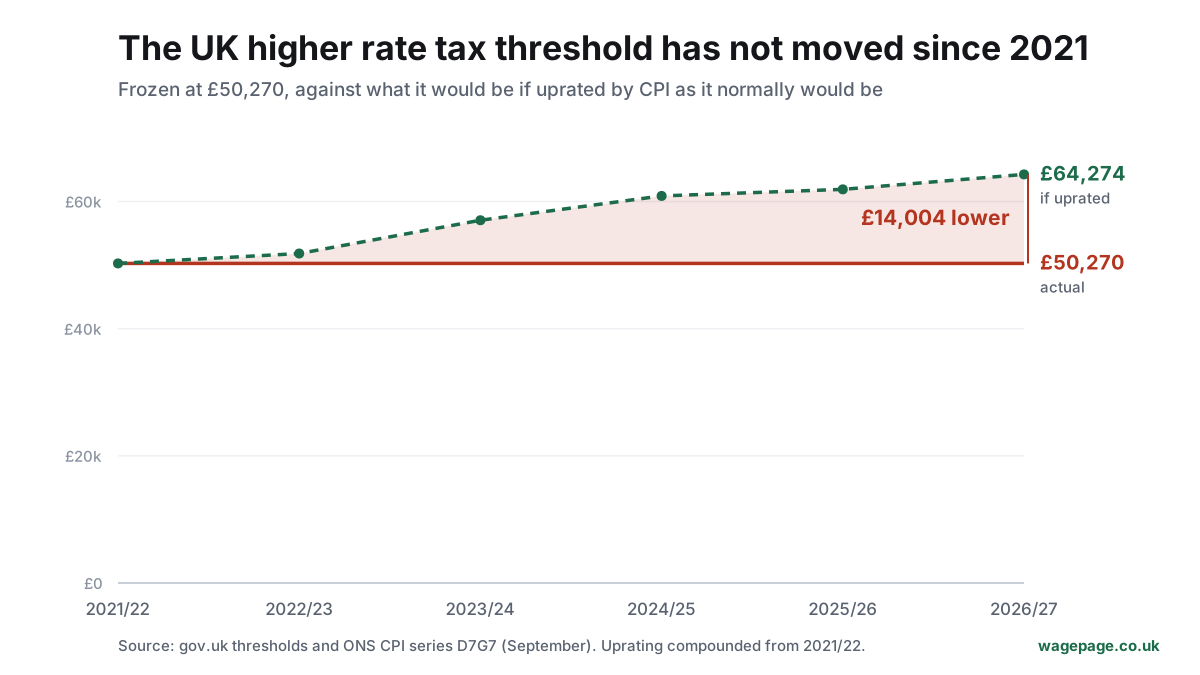
The red line is the higher rate threshold as it actually is, frozen at £50,270. The green line is where it would be if it had been uprated by CPI each year. The shaded area between them is fiscal drag.
| Tax year | Your salary | Allowance | Would have been | Extra tax |
|---|
Use this chart
The chart is free to use anywhere, including commercially, with a link back. It updates itself when the figures change, so an embedded copy stays current.
Copy this to embed it:
Or link straight to the image. If you are writing about this and want the underlying numbers for a different salary, they are all on this page and reproducible from the two sources below.
Provenance
How this is worked out
Income tax thresholds are normally uprated by the Consumer Prices Index figure for the September before the tax year starts. That is the statutory default, and it is why this uses September CPI rather than an annual average: measuring against any other month would be measuring against a rule that does not exist.
So the September 2021 CPI of 3.1% would have uprated 2022/23, September 2022's 10.1% would have uprated 2023/24, and so on. Compounded to 2026/27 that is a factor of 1.2786. Applied to the 2021/22 thresholds it gives a Personal Allowance of about £16,072 and a higher rate threshold of about £64,274.
The same salary is then charged under both sets of thresholds, and the difference is the drag. Nothing else changes between the two runs.
What is deliberately left out
National Insurance is reported next to the answer but never folded into it. The main rate fell from 12% to 8% over the same period, so an analysis that quietly combined them could be dismissed as picking whichever direction suited the argument. Both figures are true and both are shown.
No rounding is applied to the uprated thresholds. Real uprating rounds to a statutory convention, and rather than guess at the exact rule it is left out. It would move an allowance by a few pounds and the tax by about a pound.
The £100,000 point where the Personal Allowance starts to taper is held at £100,000 in both runs, because it has never been indexed, even before the freeze. Uprating it would invent a policy that has never existed.
Questions
What is fiscal drag?
When tax thresholds stay the same while wages rise, more of your income is taxed and more people cross into higher bands, without any rate ever changing. The Personal Allowance and the higher rate threshold have been frozen since April 2021, which is why it is happening now.
How much would the thresholds be if they had not been frozen?
Income tax thresholds are normally uprated by the previous September's CPI. Applying that to the 2021/22 figures gives a Personal Allowance of about £16,072 for 2026/27 instead of £12,570, and a higher rate threshold of about £64,274 instead of £50,270.
Does everyone lose the same amount?
In cash, roughly yes within a band, which surprises people. The loss is the shrunken allowance multiplied by your tax rate, and that does not depend on your salary. So a basic-rate taxpayer on £25,000 loses about the same number of pounds as one on £35,000, which is a bigger share of the smaller salary. The people hit hardest are those whose pay rise carried them over £50,270, because the threshold did not move with them.
Has National Insurance not been cut though?
Yes, and it matters. The main employee rate fell from 12% to 8% between 2021/22 and now. On the same nominal salary that is worth over £1,200 a year to someone on £35,000. The figure this page gives is income tax only, so the two can be read side by side rather than netted into one number that hides both.
Where do these numbers come from?
Thresholds from gov.uk for each individual tax year, and inflation from the ONS CPI series D7G7, the September figure that the uprating rule actually names. Both are linked below. The arithmetic is a compounded CPI factor applied to the 2021/22 thresholds, then the same salary charged under both sets of rules.
Sources
- Inflation: ONS series D7G7, CPI ANNUAL RATE 00: ALL ITEMS 2015=100, dataset mm23. September figures, checked 5 August 2026.
- Thresholds: gov.uk, per tax year. Each year is held in its own dated file with its own sources.
- Context on the freeze: House of Commons Library briefings CBP-9186 and CBP-9687.
The figures here are reproducible from those two published sources alone. If you want to check them, everything you need is linked. See the methodology for how this site sources and tests its numbers, and the corrections policy for what happens when a figure turns out to be wrong.
To see what the freeze means for your own pay packet rather than your tax bill, the take-home calculator works from the current thresholds.